 WhatsApp: +98-9171792581
  Telegram ID: @aayateam
📌 Basic Technical Indicators in Forex Trading 📊
📌 How Can You Analyze Markets and Forecast Price Movements? 🤔
✅ In the Forex market, traders need powerful analytical tools to understand market trends and identify optimal entry and exit points.
✅ Technical indicators are mathematical tools based on price movements and trading volumes that help make more accurate trading decisions.
🔹 1️⃣ What Are Technical Indicators? 📊
✅ Technical indicators are computational tools relying on past price data such as open, close, high, low prices, and volume.
✅ They are used to analyze the market, identify trends, momentum, and volatility.
🔍 Types of Technical Indicators:
📌 Trend Indicators 🚀: Identify the overall market direction (uptrend or downtrend).
📌 Momentum Indicators ⚡: Measure the strength and direction of price movement.
📌 Volatility Indicators 📉: Assess price fluctuations and market activity level.
📌 Volume Indicators 🔍: Track trading volume to confirm trends.
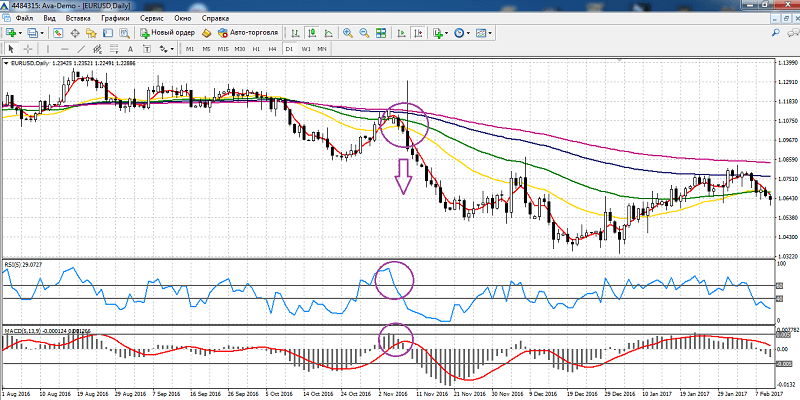
🔹 2️⃣ Moving Averages (MA) 📈
✅ Moving averages are among the simplest and most essential indicators used in Forex.
✅ They calculate the average closing prices over a specific period, helping to identify trends and filter out market noise.
📌 Types of Moving Averages:
1️⃣ Simple Moving Average (SMA) 📊: Calculates the average price over a set time period.
2️⃣ Exponential Moving Average (EMA) 🔥: Gives more weight to recent prices, making it more sensitive to new changes.
📌 How to Use:
✔️ Price above the moving average → bullish trend 📈.
✔️ Price below the moving average → bearish trend 📉.
✔️ Crossovers of moving averages (e.g., EMA 50 and EMA 200) can provide strong buy or sell signals.
📉 Drawbacks:
❌ May be slow to react to sudden market changes.
🔍 Best Use:
✅ Ideal for identifying long-term trends and spotting major trading opportunities.
🔹 3️⃣ Relative Strength Index (RSI) ⚡
✅ RSI is a momentum indicator measuring the strength or weakness of the current trend.
✅ It ranges from 0 to 100, indicating overbought and oversold conditions.
📌 How to Read RSI:
✔️ RSI above 70 → Overbought market (potential downward correction 📉).
✔️ RSI below 30 → Oversold market (possible upward reversal 📈).
📌 How to Use:
✔️ Detect trend reversals.
✔️ Divergence between price and RSI may signal an upcoming reversal.
📉 Drawbacks:
❌ Less reliable in strong trending markets.
🔍 Best Use:
✅ Excellent for timing entries and exits, especially when combined with other indicators.
🔹 4️⃣ Moving Average Convergence Divergence (MACD) 📊
✅ MACD is a strong momentum and trend-following indicator widely used in technical analysis.
📌 Components of MACD:
1️⃣ MACD Line: Difference between two EMAs (usually 12 and 26 periods).
2️⃣ Signal Line: EMA of the MACD line (usually 9 periods).
3️⃣ Histogram: The difference between the MACD line and the Signal line, showing momentum strength.
📌 How to Read:
✔️ MACD line crosses above Signal line → Buy signal 📈.
✔️ MACD line crosses below Signal line → Sell signal 📉.
✔️ Positive histogram → Increasing bullish momentum.
✔️ Negative histogram → Increasing bearish momentum.
📌 How to Use:
✔️ Identify trend beginnings and endings.
✔️ Combine with other indicators to improve analysis accuracy.
📉 Drawbacks:
❌ May produce false signals in sideways (range-bound) markets.
🔍 Best Use:
✅ Ideal for momentum analysis and confirming trends when combined with other tools.
🔹 5️⃣ Comparison of Basic Technical Indicators 📊
| Indicator | Type | Main Use | Drawbacks |
|---|---|---|---|
| Moving Averages (MA) 📈 | Trend Indicators | Identify main trends | Slow response to sudden changes |
| Relative Strength Index (RSI) ⚡ | Momentum Indicators | Identify overbought/oversold levels | False signals in trending markets |
| MACD 📊 | Momentum + Trend | Detect reversals and trends | Ineffective in sideways markets |
🔹 6️⃣ How to Use Technical Indicators Smartly? 🧠
🚀 The best approach is to combine indicators for more accurate signals!
📌 Example of an Integrated Strategy:
✔️ Use moving averages to identify the general trend 📈.
✔️ Use RSI to check if the price is in an overbought or oversold zone ⚡.
✔️ Use MACD to confirm entry and exit signals 📊.
✅ When all three indicators agree on the same trend, the trading opportunity is stronger and more reliable! 💪
💬 What’s your favorite technical indicator for trading? 🤔 Share your experience with us in the comments! 👇🔥
Comments (0)