 WhatsApp: +98-9171792581
  Telegram ID: @aayateam
📌 Trading Strategies Using Technical Analysis 📊
🚀 Want to achieve better trading results? 🤔
✅ Technical analysis is a powerful tool used by traders to identify trends, entry and exit points, and effectively manage risk.
✅ By applying trading strategies based on technical analysis, you can improve your performance and achieve your forex market goals!
📝 In this comprehensive guide, we will explore the most important trading strategies using technical analysis and how to successfully apply them!
🔹 1️⃣ What is Technical Analysis? 🎯
✅ Technical analysis studies price movements and historical data using charts and indicators to predict future trends.
✅ It relies on price patterns, technical indicators, and trading volume instead of economic news or fundamental factors.
📌 Technical analysis helps to:
✔️ Identify trends (Uptrend 📈 – Downtrend 📉 – Sideways/Range-bound 🔄).
✔️ Find optimal entry and exit points.
✔️ Manage risk smartly and minimize losses.
🔹 2️⃣ Key Tools Used in Technical Analysis 📊
📌 Before applying strategies, you must know the essential tools used in technical analysis:
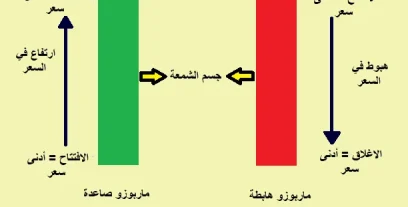
✔️ Charts – such as Japanese Candlesticks 📊.
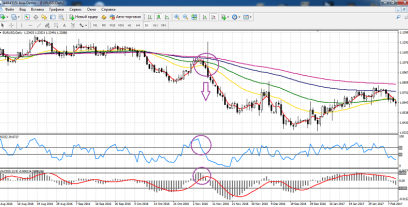
✔️ Trend Indicators – like Moving Averages (MAs).
✔️ Momentum Indicators – such as RSI and MACD.
✔️ Support and Resistance levels – to identify strong trading zones.
✔️ Japanese candlestick patterns – like Hammer, Shooting Star, Bullish and Bearish Engulfing.
🔹 3️⃣ Trading Strategies Using Technical Analysis 🎯
📌 Here are some of the strongest trading strategies based on technical analysis:
📌 1. Trend Trading Strategy 🚀
✅ Based on identifying the main trend (up or down) and trading in its direction.
✅ Tools used:
✔️ Moving Averages (50 & 200) 📈 → to determine the overall trend.
✔️ Trend Lines 📊 → for drawing price channels.
✔️ MACD or RSI → to confirm trend strength.
📌 How to execute:
🔹 If price is above both the 50 and 200 MAs → Uptrend (Buy) 📈.
🔹 If price is below both the 50 and 200 MAs → Downtrend (Sell) 📉.
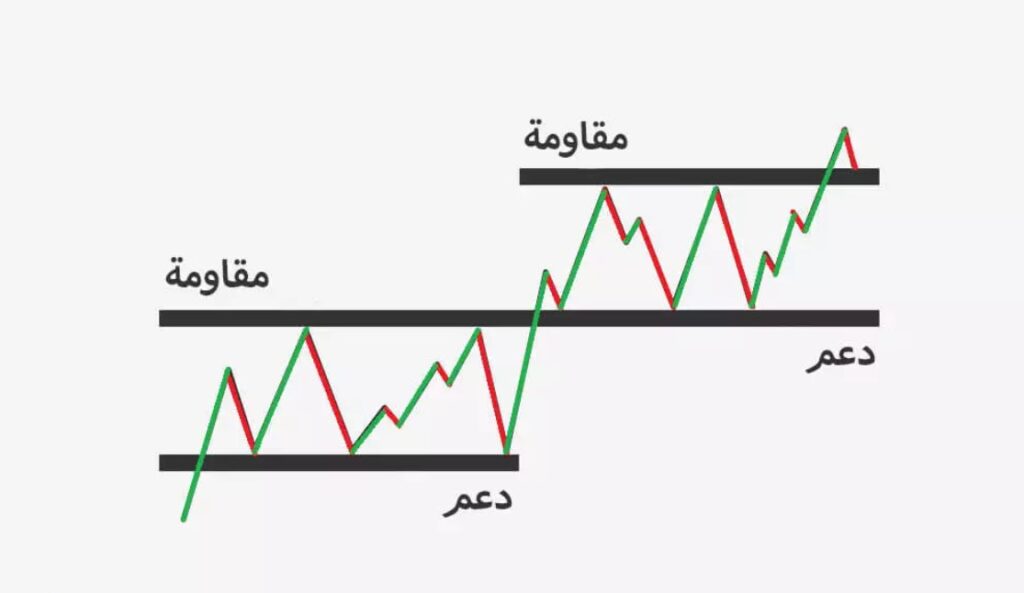
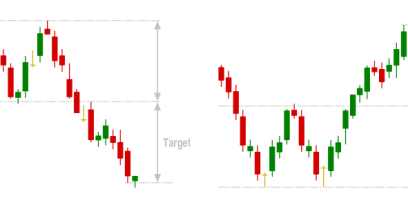
📌 2. Support and Resistance Strategy 🏆
✅ Relies on identifying strong levels where price tends to bounce.
✅ Tools used:
✔️ Horizontal Support and Resistance levels.
✔️ Candlestick patterns.
✔️ Momentum indicators like RSI.
📌 How to execute:
🔹 Buy near support → when price approaches a strong support level and shows a bullish pattern like a Hammer 🛠️.
🔹 Sell near resistance → when price nears a strong resistance level and shows a bearish pattern like a Shooting Star 🌠.
📌 3. Breakout Trading Strategy 🚀
✅ Based on entering trades when price breaks support or resistance levels with strong momentum.
✅ Tools used:
✔️ Support and resistance levels.
✔️ Volume indicator.
✔️ MACD or RSI to confirm the breakout.
📌 How to execute:
🔹 If price breaks resistance with strong momentum 📈 → open a buy trade.
🔹 If price breaks support with strong momentum 📉 → open a sell trade.
📢 Tip: Avoid false breakouts — wait for confirmation from technical indicators!
📌 4. Pullback Trading Strategy 🔄
✅ Involves entering trades when price pulls back within a strong trend.
✅ Tools used:
✔️ Moving averages.
✔️ Fibonacci Retracement levels.
✔️ Indicators like RSI to confirm overbought or oversold conditions.
📌 How to execute:
🔹 In an uptrend, wait for a price correction to the 38.2% or 50% Fibonacci retracement level, then enter a buy 📈.
🔹 In a downtrend, wait for a correction to the 38.2% or 50% Fibonacci level, then enter a sell 📉.
📢 Note: This strategy works best with strong trending markets!
📌 5. Trading Using RSI Indicator 📊
✅ Measures market momentum and identifies overbought or oversold conditions.
✅ Tools used:
✔️ Relative Strength Index (RSI).
✔️ Support and resistance levels.
📌 How to execute:
🔹 RSI below 30 → market is oversold → potential reversal upwards (buy signal) 📈.
🔹 RSI above 70 → market is overbought → potential reversal downwards (sell signal) 📉.
📢 Tip: Use RSI in conjunction with other indicators for confirmation!
🔹 4️⃣ Comparison of Technical Analysis Strategies 📊
| Strategy | Best Use Case | Indicators Used | Strength |
|---|---|---|---|
| Trend Trading 📈 | Markets with clear trends | Moving Averages, MACD | Strong |
| Support & Resistance 🏆 | All market types | Support/Resistance levels, RSI | Moderate |
| Breakout 🚀 | After consolidation/range | Volume, MACD | Very strong |
| Pullback 🔄 | During price corrections | Fibonacci, Moving Averages | Strong |
| RSI 📊 | Overbought/oversold zones | RSI, Support/Resistance | Moderate |
🔹 5️⃣ Conclusion 📝
✅ Technical analysis is a powerful tool for market analysis and smarter trading decisions.
✅ The best trading strategies require a combination of indicators and technical levels.
✅ Risk management is essential! Never risk more than 2-3% of your capital on a single trade.
✅ Practice and demo account training before live trading is fundamental!
📢 What is your favorite trading strategy? 🤔 Share your thoughts in the comments! 👇🔥
Comments (0)