 WhatsApp: +98-9171792581
  Telegram ID: @aayateam
📌 Types of Charts Used in Forex Trading 📊
📌 How Can You Analyze Price Movements in Forex? 🤔
✅ To understand price behavior in the Forex market, traders need effective tools to interpret historical data. Charts are the primary tool used to analyze prices and make trading decisions.
📈 In this guide, you’ll discover the most commonly used chart types in Forex and how each one can help you professionally analyze the markets!
🔹 1️⃣ What Are Charts in Forex? 📊
✅ Charts are visual representations of price movement over a specific time frame.
✅ They are used to identify trends and patterns that help traders make buy or sell decisions.
✅ Each chart type provides different insights based on the chosen analysis approach.
🔍 Key elements of a trading chart:
📌 X-axis (horizontal): Represents time (minutes, hours, days, etc.).
📌 Y-axis (vertical): Represents the price of a currency or financial asset.
🚀 The main types of Forex charts are:
1️⃣ Line Chart 📈
2️⃣ Bar Chart 📊
3️⃣ Candlestick Chart 🕯️
🔹 2️⃣ Line Chart 📈
✅ A Line Chart is the simplest type of chart. It shows only the closing price for each time period connected by a continuous line.
📌 Advantages:
✔️ Easy to read and understand trends.
✔️ Useful for long-term trend analysis.
✔️ Filters out noise from small price fluctuations.
📉 Disadvantages:
❌ Does not show details like the open, high, or low prices.
❌ Not ideal for advanced technical analysis.
🔍 Best use:
✅ Perfect for traders who want a general view of market direction without extra details.
🔹 3️⃣ Bar Chart 📊
✅ The Bar Chart provides more detail than the line chart, displaying four essential price points for each time period:
1️⃣ Open Price 🔵
2️⃣ Close Price 🟢
3️⃣ High Price 🔺
4️⃣ Low Price 🔻
🔹 Each vertical bar shows the price range, with small horizontal ticks representing the open (left) and close (right).
📌 Advantages:
✔️ Displays complete price information for each period.
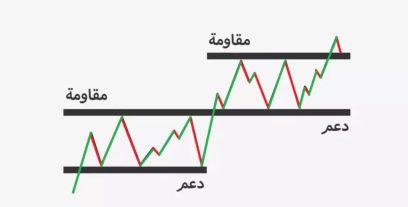
✔️ Helps identify market volatility, support, and resistance levels.
✔️ Widely used in technical analysis.
📉 Disadvantages:
❌ Can be harder for beginners to interpret.
❌ Doesn’t clearly reflect market sentiment like candlesticks do.
🔍 Best use:
✅ Great for traders who require detailed price action insights across multiple timeframes.
🔹 4️⃣ Candlestick Chart 🕯️
✅ The Candlestick Chart is the most popular among traders because it delivers detailed price data with a visually intuitive display.
🔹 Each candlestick represents a set time period (minute, hour, day, etc.) and shows:
1️⃣ Open Price 🔵
2️⃣ Close Price 🟢
3️⃣ High Price 🔺
4️⃣ Low Price 🔻
📌 How to read candlesticks?
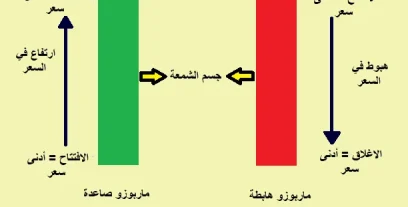
✅ Bullish Candle 🟢 → Close is higher than open (uptrend).
✅ Bearish Candle 🔴 → Close is lower than open (downtrend).
✅ Upper & Lower Shadows (Wicks) 🕯️ → Indicate the highest and lowest prices during the period.
📌 Advantages:
✔️ Provides rich price action details in a user-friendly format.
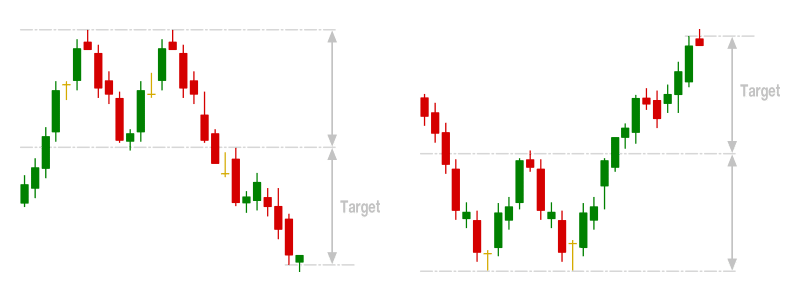
✔️ Helps spot reversal and continuation patterns.
✔️ Offers strong trade signals based on candlestick formations.
📉 Disadvantages:
❌ Requires experience to interpret complex patterns.
❌ Might be overwhelming for beginners due to the variety of shapes and names.
🔍 Best use:
✅ Ideal for traders who rely on technical analysis and candlestick pattern recognition for trading decisions.
🔹 5️⃣ Chart Type Comparison 📊
| Chart Type | Advantages ✅ | Disadvantages ❌ | Best Use 📌 |
|---|---|---|---|
| Line Chart 📈 | Easy to read, shows overall trend | Lacks price detail | Long-term trend analysis |
| Bar Chart 📊 | Full price data (O/H/L/C) | Harder to read for beginners | Support/resistance, quick trades |
| Candlestick Chart 🕯️ | Visual detail, market psychology insight | Needs pattern knowledge | Technical analysis, short-term strategies |
🔹 6️⃣ Which Chart Type Is Best for Forex Trading? 🤔
🚀 The best chart depends on your trading style!
✅ Want a quick overview of market direction? → Use the Line Chart.
✅ Need detailed insight into price movement? → Go for the Bar Chart.
✅ Looking to analyze patterns and market psychology? → Choose the Candlestick Chart.
💡 Most professional traders rely mainly on Candlestick Charts for their visual clarity and ability to reflect market sentiment and upcoming price moves! 🕯️📊
💬 Which chart type do you use in your trading? 🤔 Share your experience with us in the comments! 👇🔥
Comments (0)