 WhatsApp: +98-9171792581
  Telegram ID: @aayateam
📌 What Is Technical Analysis in Forex? 🔍📊
Technical analysis is one of the most powerful tools traders use to forecast price movements in the Forex market based on historical data and chart patterns.
💡 It’s built on the idea that “price reflects everything” and that price patterns tend to repeat due to trader psychology. 📉📈
🚀 In this guide, you’ll learn what technical analysis is and how to use it to enhance your trading decisions!
🔹 1️⃣ What Is Technical Analysis? 📊
✅ Technical analysis involves studying price charts and market patterns to predict future trends.
It’s based on the belief that prices move in patterns that repeat over time due to collective trader behavior.
📌 Core Principles of Technical Analysis:
- ✔️ Price Discounts Everything: News, economic data, and supply/demand are all reflected in the price.
- ✔️ History Repeats Itself: Market moves often follow recurring patterns.
- ✔️ Prices Move in Trends: Uptrend, downtrend, or sideways movement.
🔍 Main Tools of Technical Analysis:
- 📉 Price Charts
- 📊 Technical Indicators
- 🕯️ Candlestick Patterns
- 📌 Support & Resistance Levels
🔹 2️⃣ Technical vs. Fundamental Analysis 🧐
| Factor | Technical Analysis 📊 | Fundamental Analysis 📉 |
|---|---|---|
| Basis | Price charts & patterns 📈 | Economic news & monetary policies 📰 |
| Tools | Moving Averages, Oscillators, Patterns 🔍 | Interest Rates, Inflation, GDP 📊 |
| Time Frame | Intraday & short-term trades ⏳ | Long-term investments 📆 |
| Goal | Identify trends, entry & exit points 🔥 | Understand economic drivers 🌍 |
✅ Many professional traders combine both methods to get the best results! 🚀
🔹 3️⃣ Top Tools in Technical Analysis 🔥
📌 A) Price Charts 📊
✅ Charts are the foundation of technical analysis, showing price action over time.
- Line Chart: Displays closing prices over time.
- Bar Chart: Shows open, high, low, and close prices.
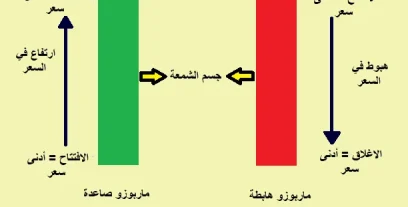
- Candlestick Chart 🕯️: The most popular chart type, offering visual clarity on price direction and momentum.
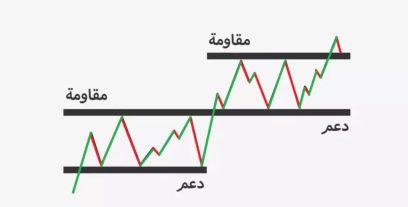
📌 B) Support & Resistance Levels 🔍
✅ Support: A price level where buying interest may push the market up.
✅ Resistance: A price level where selling interest may push the market down.
📌 How to use them:
- 📊 Near support, consider buy opportunities.
- 📉 Near resistance, consider sell opportunities.
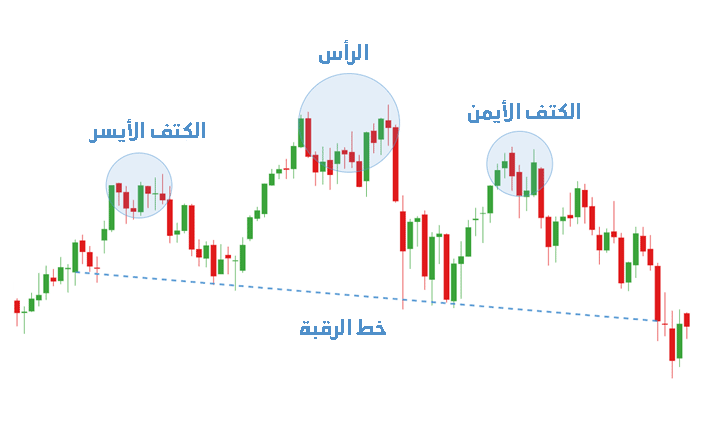
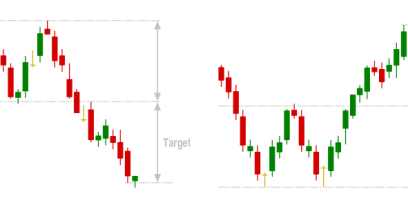
📌 C) Trends & Price Patterns 📈
✅ Price moves in three main directions:
- 🔹 Uptrend 📈 – Higher highs and higher lows.
- 🔹 Downtrend 📉 – Lower highs and lower lows.
- 🔹 Sideways/Range 🔄 – Consolidation within a range.
📌 How to spot trends:
✅ Use Trendlines to visualize the general direction of price.
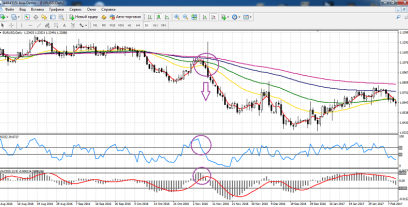
📌 D) Technical Indicators ⚡
✅ Indicators are mathematical tools used to analyze price behavior and identify trading signals.
📌 Most Popular Forex Indicators:
- 📉 Moving Averages (MA) – Identify trends and help confirm trade entries/exits.
- 📊 Relative Strength Index (RSI) – Measures momentum and detects overbought/oversold conditions.
- 📈 MACD (Moving Average Convergence Divergence) – Detects trend reversals via signal line crossovers.
- 🔍 Bollinger Bands – Measure market volatility and potential reversal zones.
✅ These indicators provide greater accuracy in your trading decisions! 🚀
🔹 4️⃣ How to Apply Technical Analysis in Trading? 🎯
📌 1️⃣ Identify Market Trends 📈
✅ Use moving averages and trendlines to detect the overall direction.
📌 2️⃣ Find Entry & Exit Points 🏆
✅ Apply support/resistance levels and indicators to spot optimal trade zones.
📌 3️⃣ Practice Risk Management ⚠️
✅ Use Stop Loss to protect capital.
✅ Set Take Profit levels based on market analysis.
📌 4️⃣ Combine Multiple Tools 🔥
✅ Don’t rely on just one method. Blend chart patterns + indicators for robust strategies.
🔹 5️⃣ Pros & Cons of Technical Analysis 🧐
| Pros ✅ | Cons ❌ |
|---|---|
| Pinpoints accurate entry/exit levels 🔥 | Less reliable in highly volatile markets 📉 |
| Applicable to any market (Forex, stocks, crypto) 📊 | Requires experience in reading charts 📈 |
| Ideal for intraday & swing trading ⏳ | Some indicators may produce false signals 😕 |
| Can be combined with fundamental analysis 💡 | Doesn’t account for sudden economic news 📉 |
🔹 6️⃣ Pro Tips for Using Technical Analysis Successfully 🎯
✅ Don’t depend on a single indicator—combine multiple tools.
✅ Learn how to read candlestick formations to gauge market momentum.
✅ Always test your strategies on a demo account first.
✅ Practice risk and money management to avoid major losses.
✅ Keep an eye on economic news, as it can override technical setups!
💡 Do you use technical analysis in your Forex trading? 🤔
Tell us about your experience in the comments! 👇🚀
Comments (0)